• Skip to primary navigation
  • Skip to main content
The Grazingland Animal Nutrition Lab logo

Grazingland Animal Nutrition Lab

Laboratory offering decision support for better nutritional management of livestock and stewardship of natural resources

  • GAN Lab: Grazingland Animal Nutrition Laboratory
    • GAN Lab Services
    • FNIRS/NUTBAL Sampling Contracts for USDA/NRCS Customers
    • Pricing and Sampling Information
    • Additional Information on Nutritional Monitoring
    • GAN Lab FAQ
    • Lab Staff
    • Contact Us
  • Decision Support Systems
    • NIRS: Near infrared reflectance spectroscopy
    • NUTBAL: Livestock nutrition balance decision support system
    • FRAMS: Forage risk assessment management system
    • BRASS: Burning risk assessment support system
    • LMIS: Livestock marketing information system
    • PestMan: Brush and weed management decisions for Texas and New Mexico
    • PHYGROW: Phyto mass growth model
  • Projects
    • USDA Forest Service BRASS: Burning Risk Advisory Support System
    • Mali Livestock and Pastoralist Initiative
    • Mongolia LEWS: Livestock Early Warning System
    • East Africa LEWS: Livestock Early Warning System
  • Publications
  • Careers
  • Show Search
Hide Search

Archives for April 2022

East Africa LEWS: Livestock Early Warning System

gabe.saldana · April 25, 2022 ·

East Africa LEWS: Livestock Early Warning System

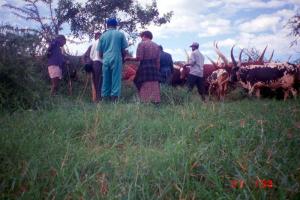
Understanding and communicating the emergence of drought — allowing pastoral communities to cope with a rapidly changing environment

Striking a balance

Farmers and livestock in east Africa

The delicate balance between selecting and maintaining a stocking rate that meets the short-term economic goals needed for ranch or pastoral household survival versus one that sustains long-term livestock carrying capacity has long dominated the decision-making process of livestock producers worldwide. This process is driven by the level of human needs of the decision-maker in relation to the level of risk an individual is willing to undertake under any livelihood.

With emerging problems associated with the increasing population, erratic climatic patterns with a higher frequency of drought, limited marketing opportunities, changing land tenure patterns, rising social conflict, limited water supply, and greater incidences of disease transmission, the traditional coping strategies of farmers, ranchers and pastoralists have become inappropriate. More uncertainties require new innovations in characterizing, monitoring, analyzing and communicating the emergence of drought to allow pastoral communities to cope with a rapidly changing environment.

East Africa LEWS: A collaborative solution

Map showing predicted quantity of forage in the East Africa LEWS program area

In collaboration with National Agricultural Research System in Kenya, Ethiopia, Uganda and Tanzania, scientists at Texas A&M University funded by USAID (1997-2003) through the Global Livestock Collaborative Research Support Program developed the Livestock Early Warning System (LEWS).
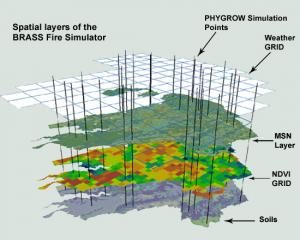
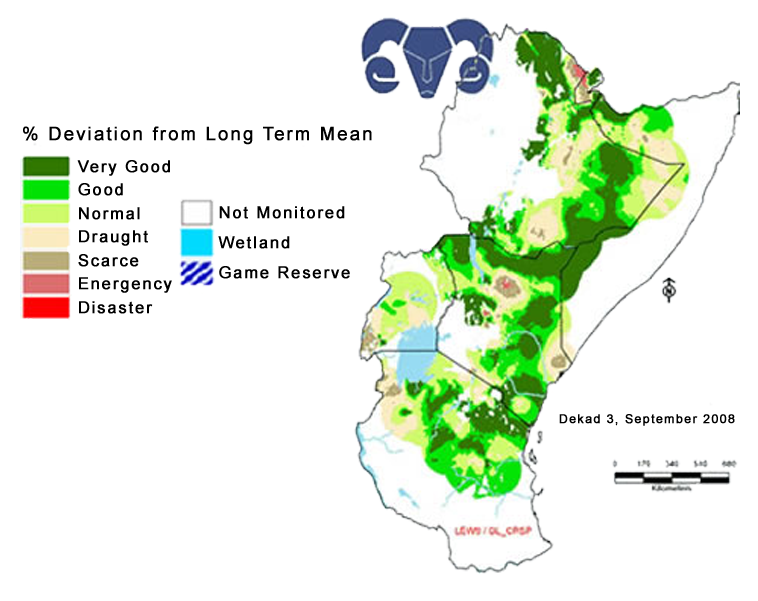
The LEWS was designed to provide an early warning system for monitoring rangeland forage conditions, livestock nutrition and health for maintaining the food security of pastoralists. The program framework is an integral part of the existing system for drought and famine in pastoral areas of Ethiopia, Djibouti, Somaliland, Kenya, Uganda, and Tanzania. The development and implementation of LEWS include spatial characterization, the establishment of monitoring sites, biophysical modeling, model analysis, and field verification and automation of information dissemination.

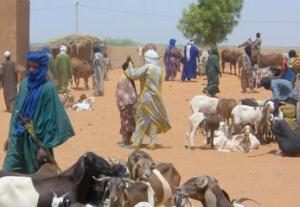
The central thrust of the LEWS project is to provide information on impending drought insufficient lead-time to allow the government, NGOs and pastoral communities to react to the conditions in a timely manner to prevent resource degradation and loss of assets. Timely decision making by livestock owners concerning the availability of forage supply, movement, destocking, and restocking of livestock will be valuable for sustainable livestock production in eastern Africa.

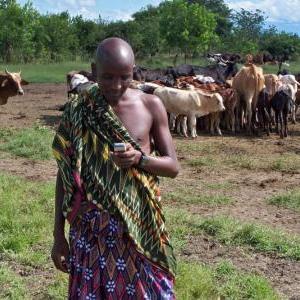
The indigenous knowledge of the pastoral societies regarding range and livestock is much more effective if they can have access to near real-time information on impending forage shortages for livestock and location of forage supplies. This minimizes conflict during periods of restrictive conditions. A combination of this indigenous knowledge and modern science is used by decision-makers to formulate clear mitigation strategies to reduce risk from extremes of weather conditions.

The project contributes to this noble venture by generating country-specific forage situation and deviation status reports updated every 10 days, a monthly advisory for Kenya, Tanzania, Ethiopia and Uganda, and a regional forecast report for the same countries. These reports are posted via e-mail to an array of users that include government agencies, NGOs, UN agencies, and livestock stakeholder groups.

BRASS: Burning Risk Assessment Support System

gabe.saldana · April 25, 2022 ·

BRASS: Burning Risk Assessment Support System

A continuous means for helping land managers assess vegetation, weather and wildfire risk in decision-making related to prescribed burns

Assessing, mitigating wildfire risk

Wildfire risk on rangeland is directly related to the state and condition of the vegetation and weather variables. These communities pose a high potential for wildfires during dry, windy weather conditions. Prescribed burning regimes are increasingly being utilized to mitigate future wildfire risks; however, concerns regarding unpredictable fire behavior have hampered the efforts of land managers and fire professionals. Effective vegetation monitoring and the influence of dynamic weather on potential fire behavior are of key importance in the management of rangelands. The BRASS (Burning Risk Assessment Support System) decision support tool provides a continuous means for land managers to assess vegetation and weather to support decisions related to prescribed burning and/or the risk of wildfire by utilizing near real-time weather conditions and fuel loads.

BRASS map model of Fort Hood, Texas
Illustration showing BRASS spatial layers

General System Overview

The key management objective of BRASS is to provide a decision support tool to aid in the management of rangelands, prescribed fires and wildfires, and livestock grazing.  The system is comprised of three parts, 1) a near-real-time plant growth model, PHYGROW, that is updated daily utilizing current and historical weather conditions from the National Oceanic and Atmospheric Administration (NOAA), 2) a fire simulation model called PHYRESIM, that uses the same core functionality that drives the highly respected BEHAVE Plus burning application, 3) a fire growth model called PHYREFLY that is a derivative of the FARSITE fire growth simulator.

The PHYGROW model provides the fuel loads and live moisture contents on a daily basis for each vegetation polygon in the project area.  The PHYRESIM model is then run for each vegetation polygon to simulate dead fuel moisture, spread rate, flame height, and fire intensity.  A fire danger advisory map is produced from these values for a forecasted time period of 6 days.  The PHYREFLY fire growth model is run on-demand when a fire is presently using the latest available data to predict the area covered by a fire at 30-minute intervals.  The PHYREFLY model can be used to simulate fires for a period of up to 6 days.

Interface

Two interfaces for the models were developed to allow maximum flexibility in model usage.  The primary interface is a web-based application that can be accessed through a web browser from any computer.  The application can be customized to address the needs of the project through the Common Web Interface management software.  The software allows for the customized presentation of data, map layers, and user interactivity controls.  The second interface is an ArcGIS toolbar application that can be integrated with ESRI products and third-party add-ons to support a multi-tiered customized desktop environment.

LMIS: Livestock Marketing Information System

gabe.saldana · April 25, 2022 ·

LMIS: Livestock Marketing Information System

Developing reliable, timely livestock market information for the development of East African countries

A need for reliable, timely market information

Livestock market in Ethiopia
Pastoralist in field in Tanzania

The livelihood of a vast majority of people in eastern Africa is highly dependent on income from livestock and livestock products. Therefore, the development of reliable and timely livestock market information is vital for the development of the countries in the region and provides a basis for livestock producers and traders to make marketing decisions.

The Problem

In the past few years, the urgency to address the needs of livestock-keeping communities in eastern Africa has risen dramatically, prompting national governments, NGOs and international donors to explore high impact interventions. Given the high dependency of livestock keepers’ family livelihoods on cash income from the sale of livestock and livestock products, the institutional focus has been directed toward improving livestock market information, infrastructure, and efficiency.

An extensive review of the wide array of livestock market development activities in eastern Africa revealed a lack of viable livestock market information system to support decision making of traders, producers and policymakers. A reliable market information system creates transparency and a basis for the livestock keepers to make marketing decisions.

Steps Toward A Solution

With funding support from USAID, the Livestock Information Network and Knowledge System (LINKS) of the Global Livestock Collaborative Research Support Program (GL-CRSP) has developed an Information Communication and Technology (ICT) system to extend the technical and human capacity to meet livestock information needs to support decision-making for livestock producers, traders, and policymakers in East Africa.

Using a partnership approach with existing livestock marketing institutions in the eastern Africa region, LINKS has designed and is delivering a livestock information and communication technology that provides monitoring and analysis technology to foster strategic partnerships between livestock keepers, markets and policy. Autonomous systems with near real-time databases have been established in Kenya (http://www.lmiske.net) Tanzania (http://www.lmistz.net) and Ethiopia (http://www.lmiset.net).  Additionally, given the cross-border nature of livestock trade, the project offers a regional framework where countries involved can collaborate, network and share experiences.

How it Works

One of the major aims of the LINKS project is to determine the application of and usefulness of integrated spatial, information, and communications technologies in improving the livestock market information infrastructure in eastern Africa.

The LINKS project is built around emerging information technology coupled with spatial models of livestock movement and expected prices and volumes at secondary and terminal markets to add value to the market information system.

The spatial information and communication toolkit includes Global Positioning System (GPS), mobile phones, Worldspace radios, computing analysis, and web-based platforms. Integration of these tools makes it possible for the system to carry out market chain analysis indicating the source of animals, the time taken to truck them and the associated costs of getting them to designated markets.

Obtaining Market Data

Market monitors are trained in the use of livestock market data collection formats and are given instructions and guidance on the proper ways of approaching sellers, brokers, and traders to collect reliable data in an effective way. The monitors are provided with mobile phones and scratch cards to enable them to send the collected data to the database system.

Livestock prices and volumes are collected through interviews during the peak of a market day. A trained livestock market monitor interviews five cases of each of the dominant breed, class and grade combination of animal species on that market day. Average prices by animal kind, breed, class, and grade is then calculated along with the total volumes of livestock by animal kind and the information is coded and sent into the database system using SMS, e-mail or posted directly on the web into the database system.

PestMan: Brush and weed management decisions for Texas and New Mexico

gabe.saldana · April 25, 2022 ·

PestMan

A free, web-based decision support system that assists rangeland managers in making economically beneficial brush and weed management decisions in Texas and New Mexico

Brush and weed management decisions for Texas and New Mexico

Farmer riding ATV spray rig
Man spraying cedar with insecticide backpack
Wooden fence post at dusk

PestMan is a free, Web-based decision support system that assists rangeland managers in making economically beneficial brush & weed management decisions in Texas & New Mexico. PestMan not only provides a comprehensive list of chemical and mechanical treatments for the most common problem plants in each state, but it also allows the user to examine the long-term financial gains or losses of these treatments in light of their own situation. PestMan takes the work out of deciding whether or not a brush or weed management option will increase profits from increased forage!

PestMan was developed from two previously existing programs by the Center for Natural Resource Information Technology (CNRIT) at Texas A&M University using expert recommendations for chemical and mechanical treatments. It is funded in part by the USDA Risk Management Agency and USDA NRCS. PestMan was developed by a team that included Texas AgriLife Research and Extension, New Mexico State University, Grazingland Management Systems (GMS), and Ag Force.

Access PestMan Now

A holistic decision support system for pest management

Pests affect an estimated 76% or 728 million acres of land area in the western portion of the United States. Control and management of noxious invasive brush and weed pest species continue to diminish the sustainability of our rangelands and other forage producing lands.

High costs associated with investment in many of the brush and weed control practices/programs, together with the high degree of uncertainty, forage producers face tough choices when confronted with brush/weed control decisions. Pestman provides sound pest management options associated with weed and brush control, as well as the economic impact of the options considered. This tool allows managers to analyze the economic and environmental risk associated with controlling pests invading America’s forage lands.

Background information

Prior to the development of PestMan, there was no system available for the grazing land industry that allowed an on-demand, simultaneous selection of both the technically feasible treatment alternatives and the economic risks associated with brush/weed control investment decisions. PestManis the result of combining and expanding two separate programs that have proven successful in recommending pest management products and their efficacy, as well as analyzing the economic impact of brush and weed control. The first, a computer software program called EXSEL (Expert System for Brush and Weed Control Technology Selection), was cooperatively developed by the Texas Agricultural Experiment Station and Texas Cooperative Extension in order to assist technical agency personnel and land managers with brush and weed control decisions. The second is the Grazingland Alternative Analysis Tool (GAAT), which was developed to assist forage and livestock producers in exploring the economic trade-offs of multiple scenarios associated with pest management and livestock grazing alternatives.

Rangeland weed and brush control recommendations provided by PestMan are valid only in Texas. Control recommendations may vary from state to state, even for the same species. Some of the herbicides and/or their uses recommended by PestMan are legal only in regions where they are assigned as valid treatments.

Access PestMan Now

Components of the PestMan decision support system

EXSEL

The EXSEL component of PestMan has been widely used for many years by agency personnel, farm, and ranch supply dealers, private consultants, and producers. The system was designed to provide the best treatment alternatives, application instructions, and guidance on response to expect the following application of brush control treatments. EXSEL is user-friendly, requiring a minimum of data input to accurately support mechanical and chemical brush and weed control decisions. Although the original EXSEL program will be radically revised in the development of PestMan, the essential decision support components will be utilized.

EXSEL prompts users for information essential to appropriate brush and weed control decisions, such as the target plant species, soil texture, target species density, stem diameter and height, and soil moisture status. The program then matches a specific problem with the most technically feasible treatment alternatives.

The program generates reports that contain specific chemical and mechanical treatment recommendations for the target plant species. For chemical treatments, reports include recommended rates of application for each compound as well as additives and specific application instructions. It also provides the expected level of target plant mortality, as well as expected vegetation responses, such as when to expect maximum production increases, how long they will last and when they will return to pre-treatment levels without maintenance practices. Reports also provide comments and caution statements helpful in calling attention to significant features of the treatment or regulations that must be considered.

In addition to the revision of the entire code to facilitate a more efficient database structure, other major enhancements made to the original EXSEL program now embodied in PestMan, include a plant digital image database and text information that will help users properly identify problem target plants and understand the ecology and distribution of the species. The enhancement allows users to indicate if they want to see images of the problem plant and will greatly reduce the possibility of misidentification and misapplication of control technologies. Images can be used to show immature and mature plants and flowering parts important in the selection of control recommendations and chemical rates of application. Another important component of digital imagery will be photographs of the mechanical equipment contained within the recommended control technologies. Available images also include chemical application equipment and even demonstrate appropriate application techniques.

Grazingland alternative analysis tool, GAAT

The second program component included in PESTMAN, the Grazingland Alternative Analysis Tool (GAAT), has been linked with the revised and enhanced EXSEL component to provide an economic analysis tool that is critical to any pest management decision. The GAAT decision support system (DSS) was developed by the Ranching Systems Group at Texas A&M University as part of an integrated set of DSS for and in conjunction with the Natural Resource Conservation Service (NRCS). The program allows the user to test various scenarios; create and edit enterprise budgets; create and edit brush or weed control measures and control programs; and create and edit livestock carrying capacity profiles. The user can create a scenario for a specific situation where a control practice, or set of practices, is planned for a specific location, usually a single management unit (pasture or paddock) of a ranch. Thus, information needed to estimate the economic feasibility must represent the unique conditions and characteristics of the scenario. The basic information required is entered and saved in three categories; enterprise budgets (costs and returns associated with enterprises that will utilize the grazing lands targeted for brush or weed control), control investment profiles (timing and cost of the practice(s) planned for implementation) and carrying capacity profiles (data on the grazing capacity with and without the brush or weed control practice(s) for each year in the planning period). Additional data is entered and saved via the scenario creation/selection screen. All of the information will support the user in making informed economic decisions related to pest management options.

Included in the several reports GAAT provides the user are estimates of the Net Present Value and Internal Rate of Return associated with a specific brush or weed control practice or program. GAAT also provides reports on expected annual revenues, variable costs, and net cash flows both with and without implementation of the control practice(s). Other useful information that GAAT provides the decision maker is the benefit-cost ratio over the specified planning period and the number of years required for the investment in brush or weed control to break even (total added revenue to equal total added costs). With this information, the user is able to better understand and plan for the economic and financial consequences associated with a specific choice of control practice(s).

Other enhancements

Another enhancement contained in PestMan that was not a part of the original EXSEL or GAAT programs is the inclusion of costs of chemical control treatments, both individual plant treatment alternatives and broadcast methods, as well as costs associated with mechanical control practices. Still another enhancement is guidance for users in the selection of response curves that not only provide a temporal scale of post-treatment changes but estimates of the magnitude of changes. These response curves are essential to the economic analyses by identifying the benefits expected from treatment that can then be compared to treatments and associated costs. Response curves will become the link between the two components, technology selection, and economic analysis, of the PestMan program.

Access PestMan Now

Phygrow: Phytomass growth model

gabe.saldana · April 25, 2022 ·

PHYGROW

A decision support system for above-ground herb and shrub growth, forage consumption and hydrologic processes

PHYGROW overview

graph illustration

PHYGROW, short for phytomass growth model, is a daily time step computation engine that models above ground herb and shrub growth, forage consumption, and hydrologic processes.  It is capable of modeling the growth dynamics of many plant species competing for limited resources while modeling grazing by herbivores in competition for forage resources.

Phygrow is a point-based, daily time step, algorithmic or computation engine that models above-ground plant growth, forage consumption and hydrological processes.  The model was first coded in 1990 and has undergone many enhancements since that time. The model’s original computation algorithms are a mixture of formulas adapted from other plant growth models — CREAMS, GLEAMS, EPIC, WEPP, SPUR, CENTURY, ERHYM-II — as well as the biological relationship from grass tiller level research and dietary selection conducted at Texas A&M University.

The model is capable of stimulating the growth of multiple species of plants subject to selective grazing by multiple animals on soil with multiple layers for indefinite periods of time.  Phygrow is designed to be integrated with a wide variety of weather databases, vegetation databases, and stocking rule databases. It provides output for a wide variety of data sources and formats including all relational databases, NetCDF file formats, commas-separated and tab-delimited file formats, and linkages to other models and the internet using Python, Perl, and Java web applications.

Data Requirements

Phygrow requires 4 primary data sources to run: soil, weather, grazers, and plant data. Consequently, due to the lack of available sources for plant parameters, the largest repository for such data is the database link to PHYGROW. For soils, the system was primarily designed to work with data from SSURGO or STATSGO, however, it can use soil data from any source, provided the attributes needed to run the model are supplied.  Grazing information is usually collected in the field by survey crews and entered directly into the model’s parameter database.  Weather data can be pulled from numerous sources.  We primarily use products from NOAA, however, we can use data collected from weather stations and other various sources.

Final data input to the PHYGROW model is required to be in the form of a comma-separated values (CSV) ascii file with a defined data format.  However, many data import interfaces have been written for the PHYGROW computational engine that allows for source data to be input via an interactive web page (eg. PhyWeb 2.0) or imported from existing database systems or spreadsheets.

Technology

The model has a unique capability to be started and stopped at any point in the computational process to allow full integration with data acquisition systems, automation systems, and/or other models. The PHYGROW model engine is written in the C++ programming language and uses an object-oriented design, thus allowing high efficiency in the incorporation of new scientific relationships when necessary. Because of the start-restart features of the model, simulations can be integrated at various spatial scales in terms of explicit areas across a landscape, or in a virtual landscape representing multiple plant communities and soil combinations via a spatially explicit multiple run mode.  The PHYGROW model can be run in an automated environment across multiple platforms most Linux environments and as a standalone application in Windows 10 and later.

The primary system located at CNRIT utilizes a distributive computing environment.  This allows streaming of data from many weather and soil database sources thus allowing near real-time computation of plant growth.  At the other end of the equation, other entities around the world can write applications that access the output from PHYGROW, or the output can be sent to other distributed computing systems around the world.

PHYGROW does not require the use of commercial or customized data storage systems. However, the model can use both commercial and customized data storage systems.  All the tools and middleware for the automated systems are developed with non-proprietary software.  The way the data is acquired, stored and output is dictated by the needs of the user. That is, what kind of weather data, the number of plant community/soils/grazer/weather combinations to be modeled, the frequency of reporting, the required linkages to other applications (e.g. actuarial, insurance companies, RMA) and the nature of the output (graphical, text or both on the web, ftp or other) will determine the design and functionality of the automation process.

How to Get and Use Phygrow

For information about the software, please contact Javier Osorio Leyton, Ph.D.  A user guide is also available for download.

PLEASE NOTE: if you will be running Phygrow on a Microsoft Windows computer to test your model runs and then you also run the same model on a UNIX machine, you will see slight variations in the model output. This is due to the different ways in which floating point arithmetic is handled in Windows C++ compilers versus UNIX C++ compilers. It amounts to several decimals places deep rounding error, but the errors can compound to show visibly differing results for the same model. Phygrow has been developed and tuned against the UNIX results because this version does not truncate the floating point numbers arbitrarily and therefore produces the most accurate numbers.

View Phygrow User Guide
Go to PHYWEB
Reach out for Phygrow Info
  • « Go to Previous Page
  • Page 1
  • Page 2

A member of
Texas A&M AgriLife

Texas A&M AgriLife Extension Service | Texas A&M AgriLife Research | Texas A&M Forest Service | Texas A&M AgriLife Veterinary Medical Diagnostic Lab | College of Agriculture & Life Sciences

Grazingland Animal Nutrition Lab

Compact with Texans | Privacy and Security | Accessibility Policy | State Link Policy | Statewide Search | Veterans Benefits | Military Families | Risk, Fraud & Misconduct Hotline | Texas Homeland Security | Texas Veteran's Portal | Equal Opportunity | Open Records/Public Information